Faceted histograms for a set of items, by group

When doing psychometric work, it's nice to be able to visualize the histograms of each item in one plot. When there is a key group of interest (e.g., gender, treatment assignment, diagnosis), it's useful to be able to visualize the histograms by group for each item as well. Below I show how to do this with the tinyplots R package (mostly as an example to myself since I seem to recreate the wheel every time this comes up).
First, we'll load the packages and set up the data. I'm going to use a dataset called "msqR" from the psychTools package. We'll select 10 items of a negative affect scale, plus a gender grouping that we'll recode.
#### Load packages ####

library(psych)
library(psychTools)
library(data.table)
library(tinyplot)

#### Data setup ####

data <- psychTools::msqR

setDT(data)

data <- data[, .(afraid, ashamed, distressed, guilty, hostile,
  irritable, jittery, nervous, scared, upset, gender)]

data[, Gender := as.factor(
  fifelse(gender == 1, "Male", "Female")
)]
To create the plot, we need the data in long format.
data_long <- melt(data,
  measure.vars = c("afraid", "ashamed", "distressed",
    "guilty", "hostile", "irritable",
    "jittery", "nervous", "scared", "upset"),
  variable.name = "item",
  value.name = "score"
)
Then we can create a basic version of the plot with the tinyplot package.
tinyplot(
  ~ score | Gender,
  data = data_long,
  type = "histogram",
  freq = FALSE,
  facet = ~item
)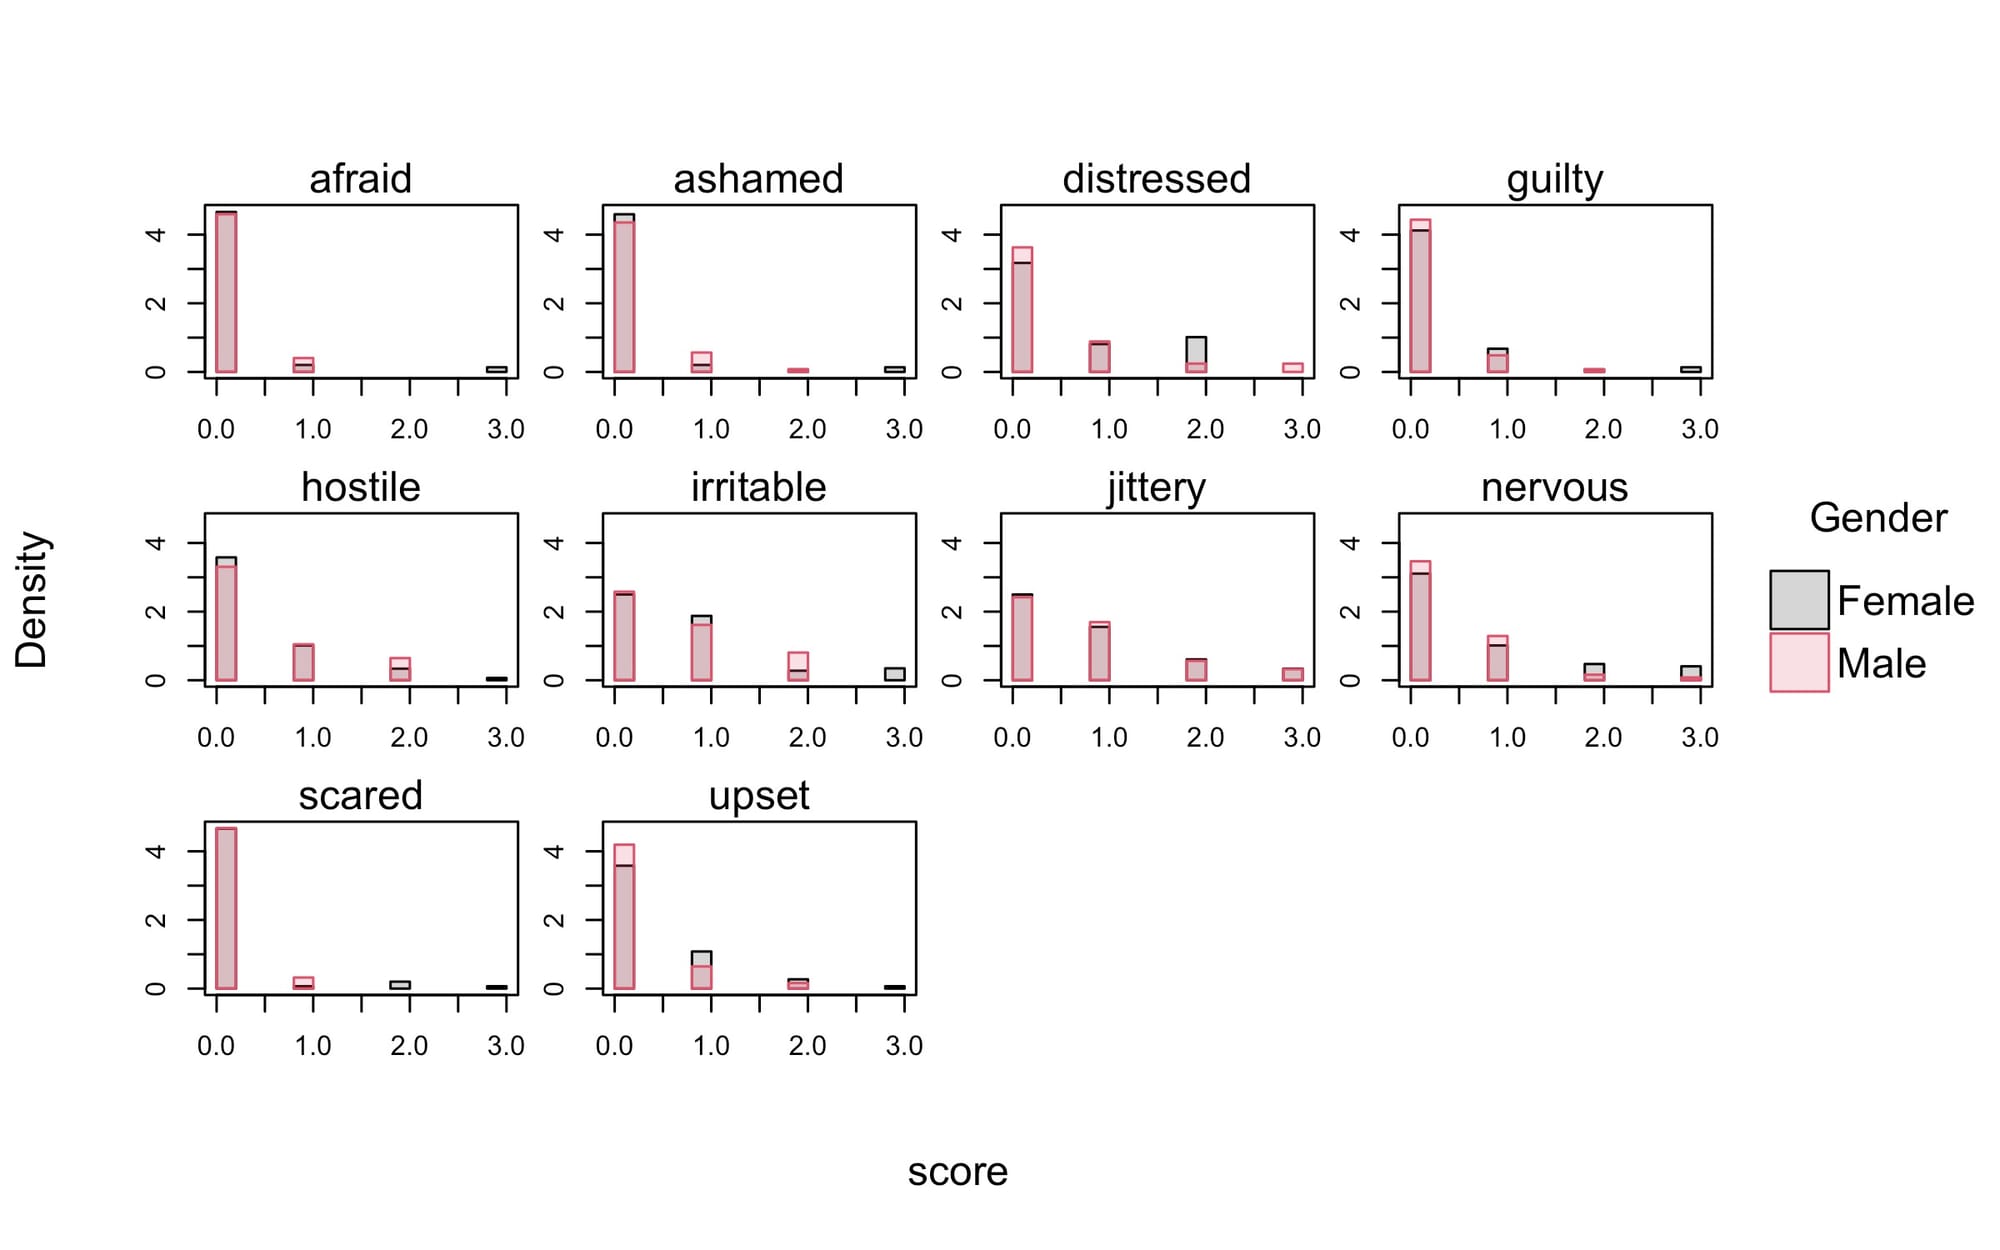
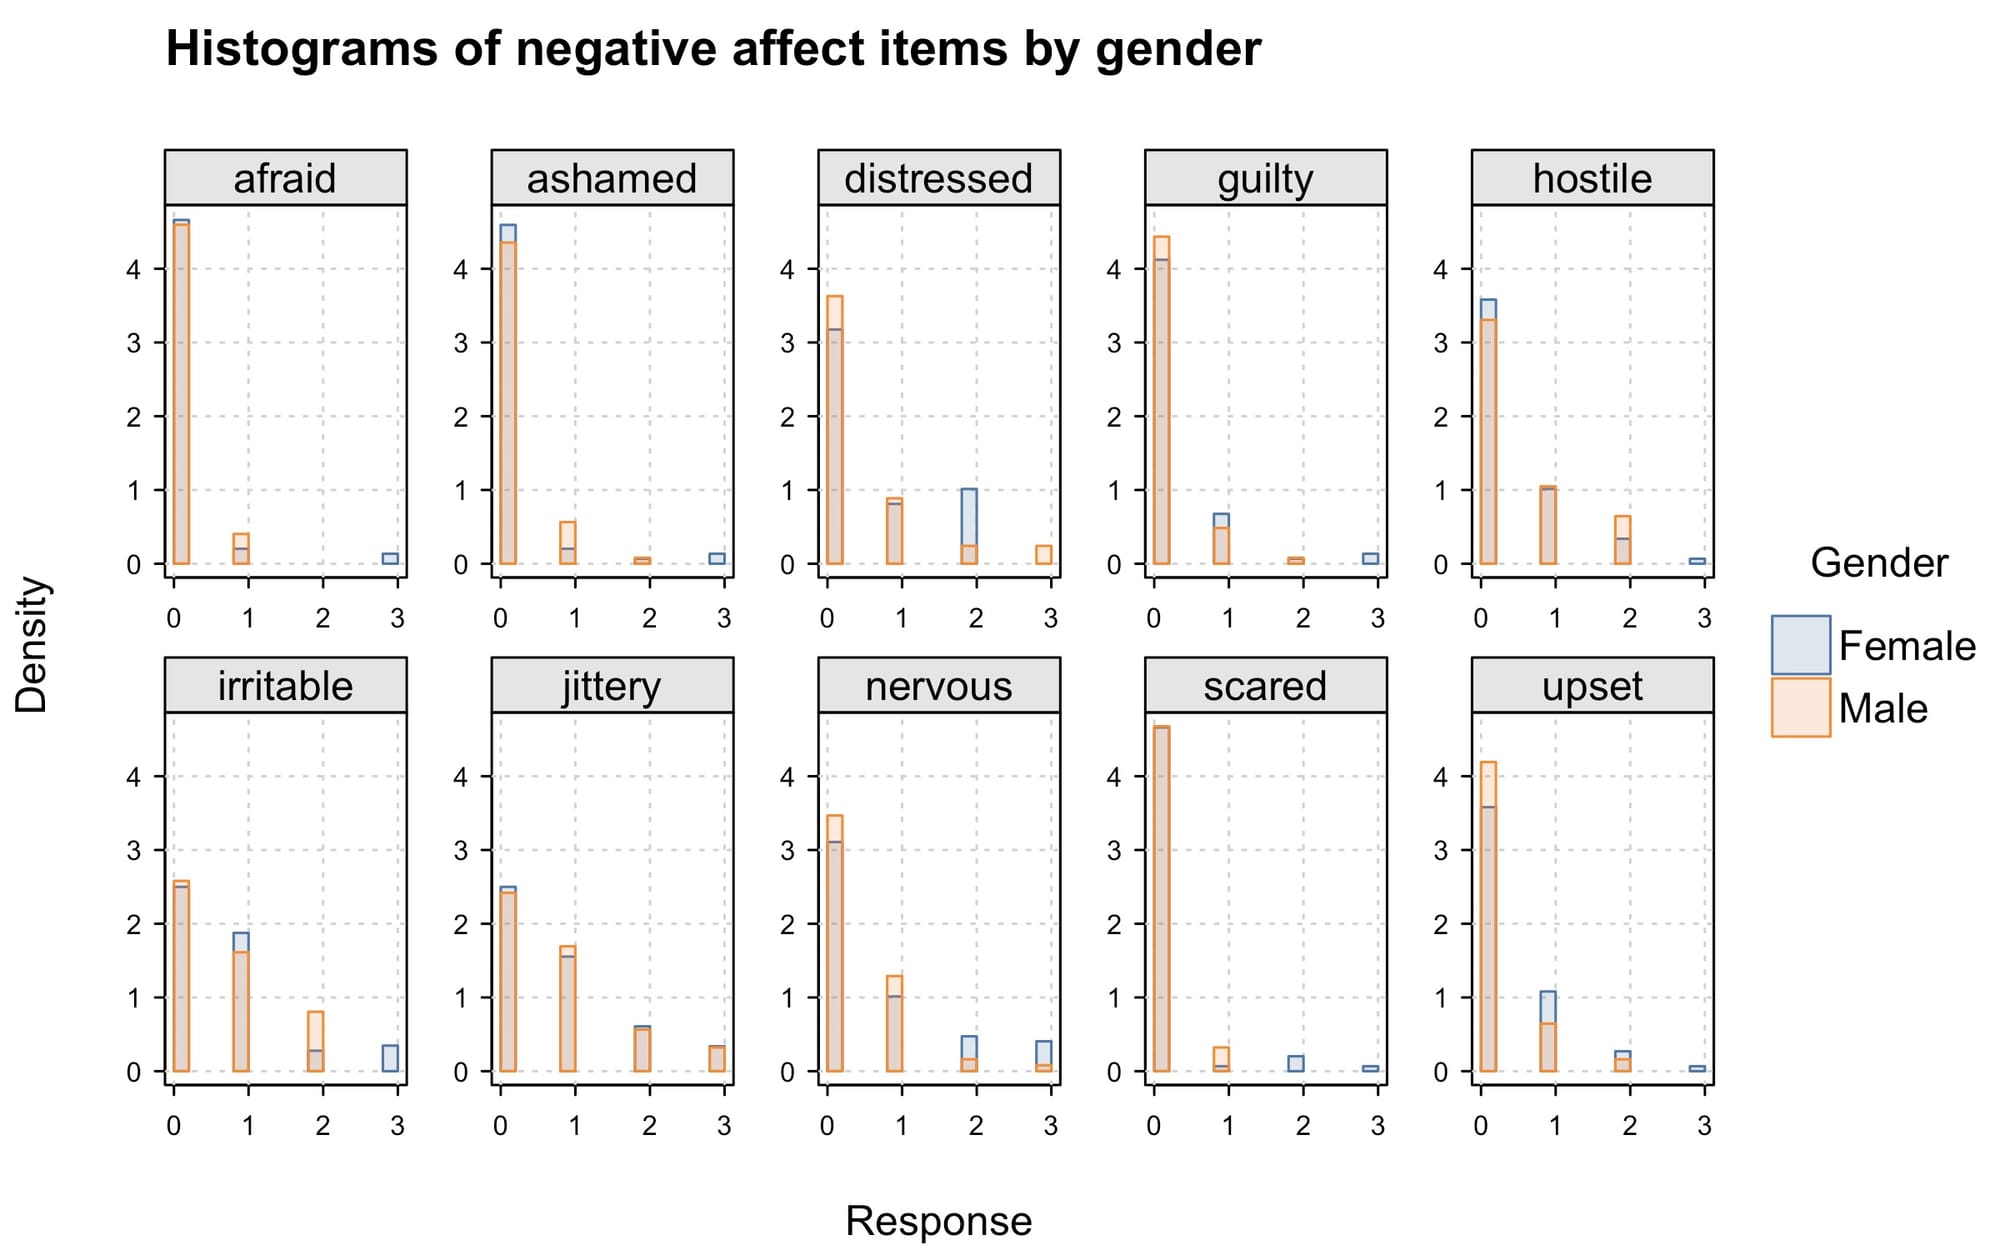
Then we can customize it a bit for a more polished product.
tinytheme("clean")

tinyplot(
  ~ score | Gender,
  data = data_long,
  type = "histogram",
  freq = FALSE,
  facet = ~item,
  facet.args = list(nrow = 2),
  xlab = "Response",
  xaxb = c(0, 1, 2, 3),
  main = "Histograms of negative affect items by gender",
  sub = ""
)
Full example code below:
#### Load packages ####

library(psychTools)
library(data.table)
library(tinyplot)

#### Data setup ####

data <- psychTools::msqR

setDT(data)

data <- data[, .(afraid, ashamed, distressed, guilty, hostile,
  irritable, jittery, nervous, scared, upset, gender)]

data[, Gender := as.factor(
  fifelse(gender == 1, "Male", "Female")
)]

#### tinyplot ####

data_long <- melt(data,
  measure.vars = c("afraid", "ashamed", "distressed",
    "guilty", "hostile", "irritable",
    "jittery", "nervous", "scared", "upset"),
  variable.name = "item",
  value.name = "score"
)

tinytheme()

tinyplot(
  ~ score | Gender,
  data = data_long,
  type = "histogram",
  freq = FALSE,
  facet = ~item,
  file = "test.jpg", width = 8, height = 5
)

tinytheme("clean")

tinyplot(
  ~ score | Gender,
  data = data_long,
  type = "histogram",
  freq = FALSE,
  facet = ~item,
  facet.args = list(nrow = 2),
  xlab = "Response",
  xaxb = c(0, 1, 2, 3),
  main = "Histograms of negative affect items by gender",
  sub = "",
  file = "final.jpg", width = 8, height = 5
)